

Beschreibung
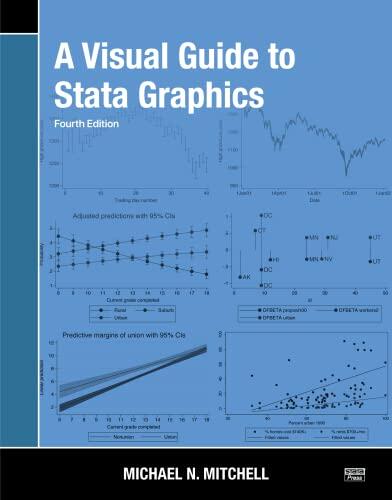
In the fourth edition of this comprehensive guide, readers are introduced to the powerful world of Stata graphics through clear explanations and visually engaging examples. The author, Michael N. Mitchell, expertly breaks down complex concepts, making them accessible to both novice and experienced users. This edition not only updates numerous examples to reflect the latest advancements in Stata but also enhances the user’s ability to create striking, informative graphics.
As he delves into various types of graphics, Mitchell provides step-by-step instructions and practical tips that ensure users can follow along with ease. The guide spans a wide range of topics, from basic plot creation to more intricate designs, allowing readers to develop a well-rounded understanding of graphical representations in statistical analysis.
Furthermore, Mitchell emphasizes the importance of tailoring graphics to meet the needs of specific audiences, reinforcing the idea that effective visual communication is key in the realm of data presentation. The author’s engaging writing style and thorough explanations invite readers to explore the creative potential of Stata graphics, encouraging experimentation and innovation.
With its wealth of information and user-friendly format, this updated edition serves as an invaluable resource for anyone looking to enhance their skills in data visualization and statistical graphics, ensuring that they can effectively communicate their findings in a clear and visually appealing manner.
Buchdetails
Format
Kindle
Seiten
1,023 Seiten
Sprache
Englisch
Veröffentlicht
Jan 1, 2021
Verlag
Stata Press
Ausgabe
4
ISBN-10
1597183660
ISBN-13
9781597183666