

Детали книги
Формат
Мягкая обложка
Страницы
499
Язык
Английский
Опубликовано
Feb 1, 2022
Издатель
Stata Press
Издание
4
ISBN-10
1597183652
ISBN-13
9781597183659
Описание
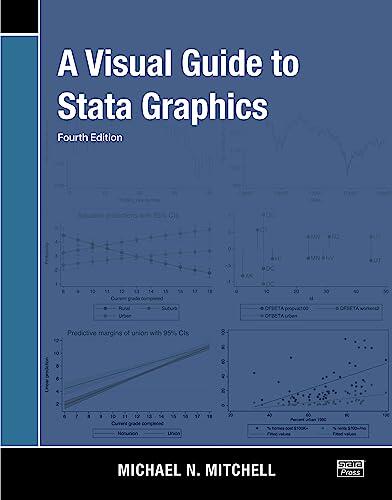
Michael N. Mitchell presents an engaging exploration of Stata graphics, designed to enhance the analytical capabilities of both novice and experienced users. This comprehensive guide serves as a visual companion, diving into the intricacies of creating powerful and informative graphics using Stata software.
With a focus on practicality, readers are introduced to a variety of graphical techniques that can elevate their data presentations. Through step-by-step instructions and clear examples, Mitchell demystifies the process of crafting compelling visual representations, ensuring that users can effectively communicate their findings.
The book highlights essential tools and methods for generating a wide array of graphics, from simple scatter plots to complex multi-panel displays. By emphasizing the importance of visual data interpretation, the work empowers readers to harness the full potential of Stata for their research and reports.
Whether for academic purposes, professional projects, or personal curiosity, this visual guide stands as an invaluable resource for those looking to master the art of data visualization in Stata.
With a focus on practicality, readers are introduced to a variety of graphical techniques that can elevate their data presentations. Through step-by-step instructions and clear examples, Mitchell demystifies the process of crafting compelling visual representations, ensuring that users can effectively communicate their findings.
The book highlights essential tools and methods for generating a wide array of graphics, from simple scatter plots to complex multi-panel displays. By emphasizing the importance of visual data interpretation, the work empowers readers to harness the full potential of Stata for their research and reports.
Whether for academic purposes, professional projects, or personal curiosity, this visual guide stands as an invaluable resource for those looking to master the art of data visualization in Stata.