

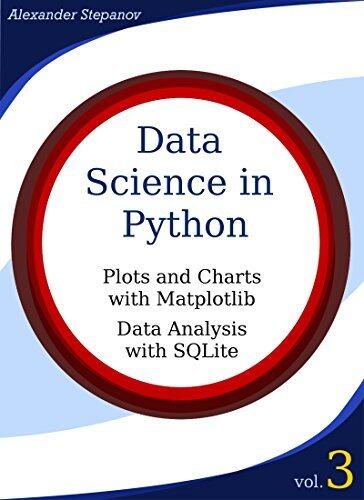
書籍詳情
格式
Kindle
頁數
90
語言
英語
已出版
Apr 25, 2016
描述
In this volume, the author delves into the essential tools and techniques for data visualization using Python, focusing specifically on the powerful Matplotlib library. Readers will discover how to create stunning plots and charts that bring data to life, enhancing their ability to communicate insights effectively. With a hands-on approach, the book provides practical examples, ensuring that concepts are easily understood and applicable.
Alongside visualization, the exploration of data analysis is a cornerstone of this work, particularly through the lens of SQLite. By integrating Python with this popular database solution, the author guides readers on how to efficiently manage and analyze large datasets. This combination empowers them to derive meaningful conclusions and support data-driven decision-making.
Overall, the volume stands as an invaluable resource for aspiring data scientists and analysts, equipping them with the knowledge to harness the full potential of Python in their analytical endeavors. Through engaging explanations and practical applications, it fosters a deep understanding of both visualization and data management, paving the way for successful data exploration.
Alongside visualization, the exploration of data analysis is a cornerstone of this work, particularly through the lens of SQLite. By integrating Python with this popular database solution, the author guides readers on how to efficiently manage and analyze large datasets. This combination empowers them to derive meaningful conclusions and support data-driven decision-making.
Overall, the volume stands as an invaluable resource for aspiring data scientists and analysts, equipping them with the knowledge to harness the full potential of Python in their analytical endeavors. Through engaging explanations and practical applications, it fosters a deep understanding of both visualization and data management, paving the way for successful data exploration.
類型
科學與技術