

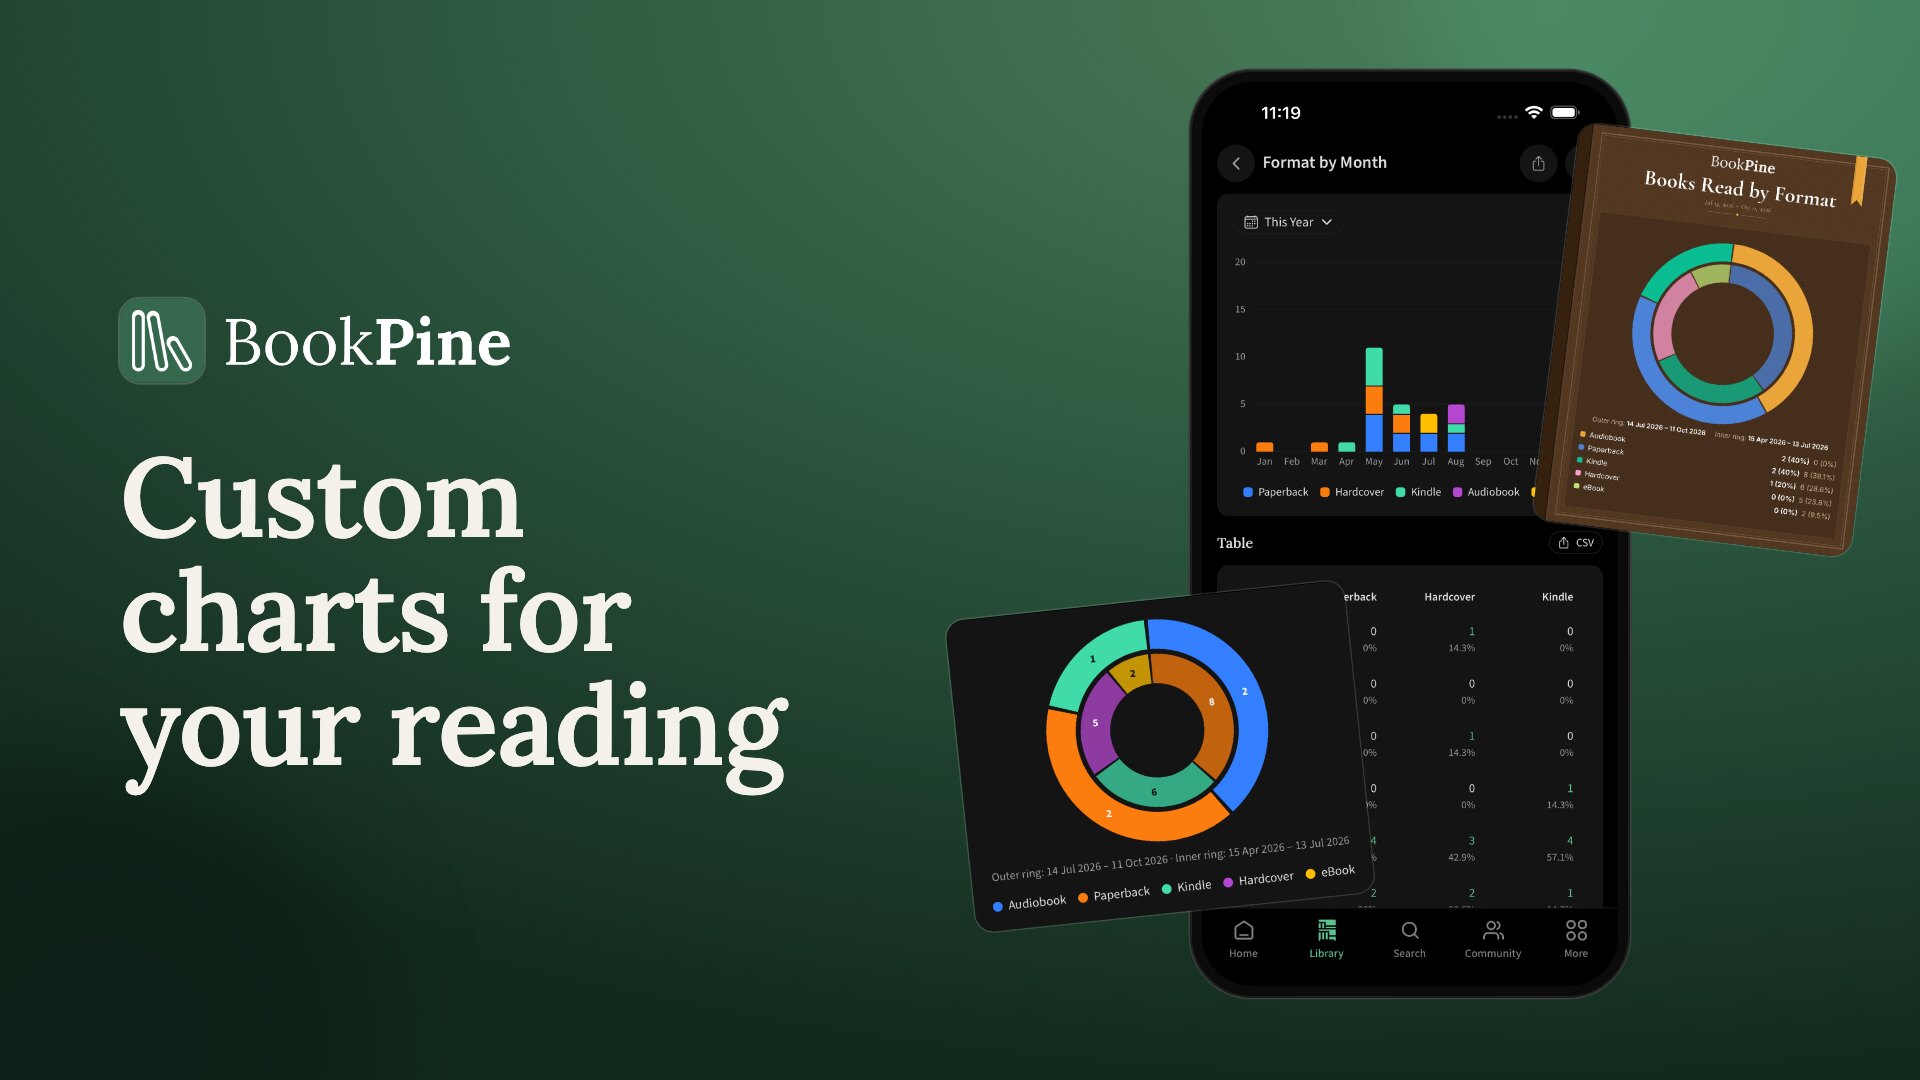
For a long time the stats page in BookPine answered the questions we thought you'd ask. Books per month, pages per year, a donut of formats. Useful, but you were stuck with our questions.
Readers kept asking us for things we hadn't built. How many fantasy books did I finish compared with romance? Do I read more on weekends? Did I read more pages this spring than last spring? So we rebuilt the stats page around charts you make yourself.
What's there when you open it
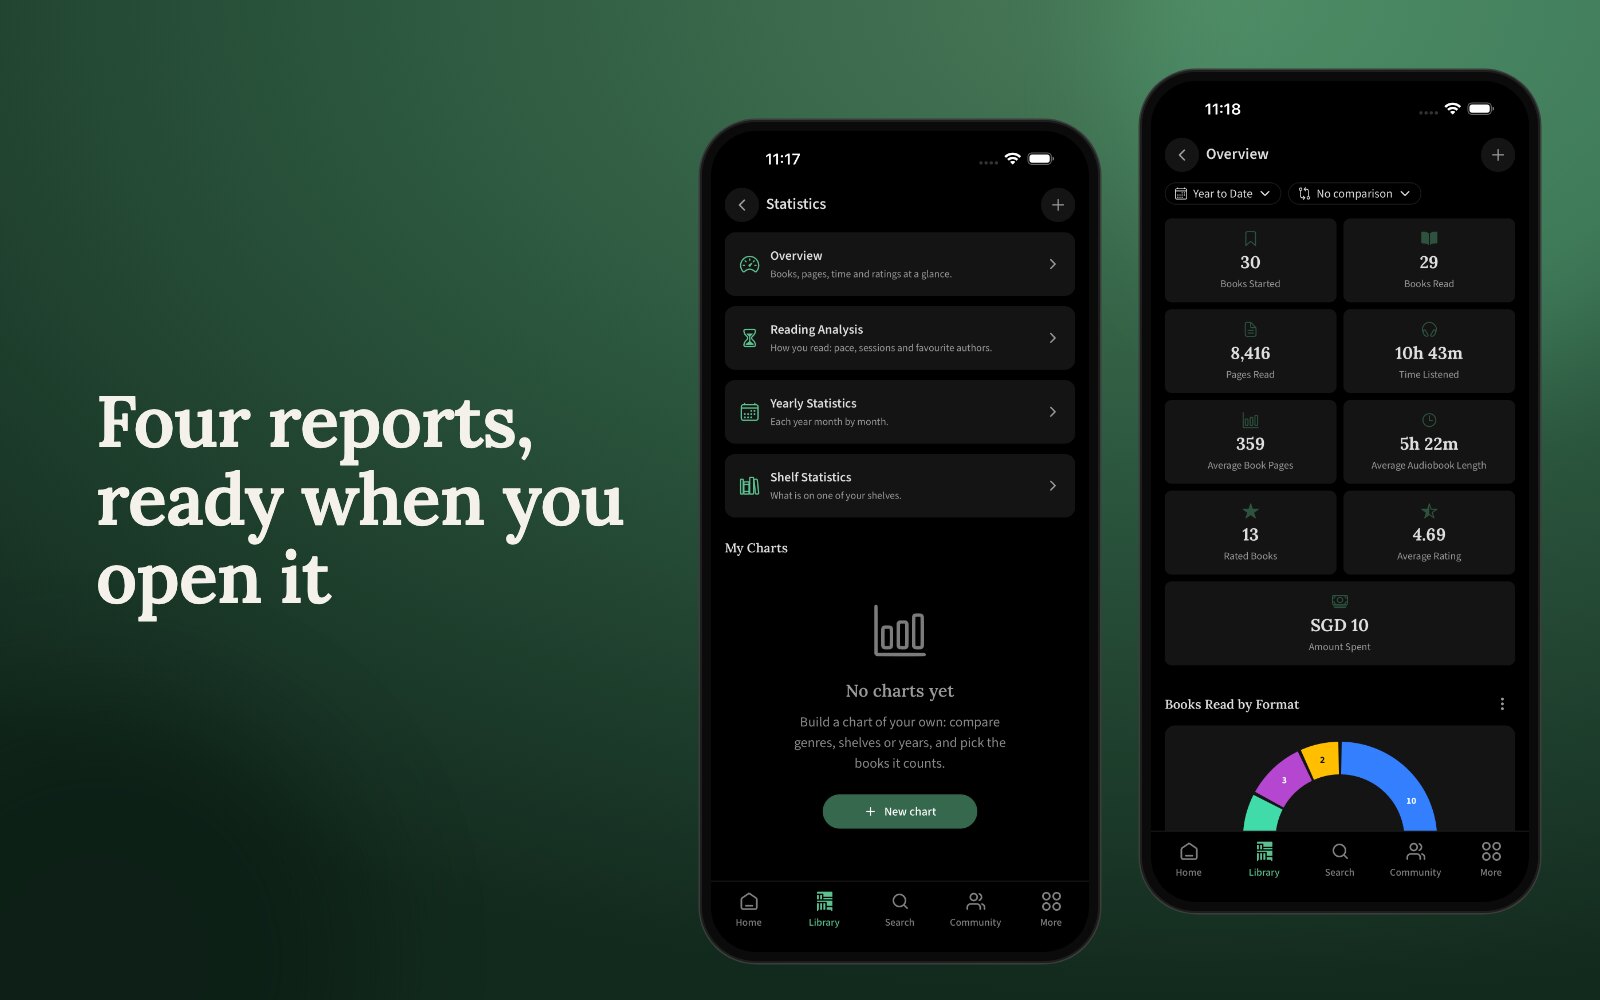
Go to Library, then Stats. Four reports are already set up for you:
- Overview has the headline numbers: books started and finished, pages, time listened, ratings, money spent.
- Reading Analysis is about pace. Pages a day, session length, reading speed, how long a book takes you.
- Yearly walks through one year, month by month.
- Shelf looks at a single shelf as a collection: its formats, genres and where its authors come from.
Pick a period at the top of a report and every chart on it follows. Your own charts sit under My Charts.
Making a chart
Tap New chart. You can start from a template or from scratch.
There are more than 35 templates, and they're the quickest way in. A few I'd start with: Books read this year vs last year, Reading seasons, Did not finish by genre, Reading time by weekday and month, How old are the books you read. The preview shows sample numbers while you set things up. Your real numbers show up once you save.
From scratch, the builder asks three things.
What to count
Choose a number. Books read, books started, pages read, time listened, reading time, sessions, days you read, reading speed, average rating, books owned, money spent, books borrowed or lent, and a couple dozen more.
Then narrow it with filters, if you want. A filter decides which books a line counts: a shelf, a genre, a tag, an author, a series, a format, a language, your rating, page count, publication year, whether you own the book, and more. You can say "is any of", "is none of", "at least 400 pages", "published before 1950", and group a few rules together with all of these or any of these.
Want two lines? Tap Add a series to compare. Each line gets its own name and its own filters, so one can count fantasy and the other romance. A chart holds up to five lines.
How to show it
Group by is where a chart starts to say something. You can group by time (day, week, month, year, month of the year, day of the week) or by something about the books: genre, format, author, series, shelf, language, publisher, your rating, page count, publication decade.
Moods, pacing, focus and content warnings come in two flavours, yours and the community's. They're separate on purpose. The book everyone calls cosy might have stressed you out.
You can also split a chart into several lines by a second thing. Group by month and split by format, and you get paper, ebook and audio for each month of the year.
Then pick the chart type: number, column, bar, line, area, donut, heatmap or table. When there's more than one line, choose whether they sit next to each other, stack, or overlap.

When
Choose the period: this week, this month, last 30 days, this year, last year, all time and so on. Members can also set their own dates, say from the start of a reading challenge to the end of it.
Below that, members can compare with the previous period or the previous year. On a column or line chart, last year's bars sit beside this year's, month for month. If this year isn't over, the comparison stops at today's date in last year too, so you're never comparing ten months with twelve.

Leave "Let me change the period on the chart" switched on and you can flip the period and the comparison right from the chart later, without opening the builder again.
Using your charts
Tap any bar, slice or point and you get the books behind it. That's the part I end up using most.
From the chart itself you can switch the period, the comparison, the grouping and the chart type to look at something a different way. The menu has the rest: edit the chart, view it as a table, reorder your charts or delete one.
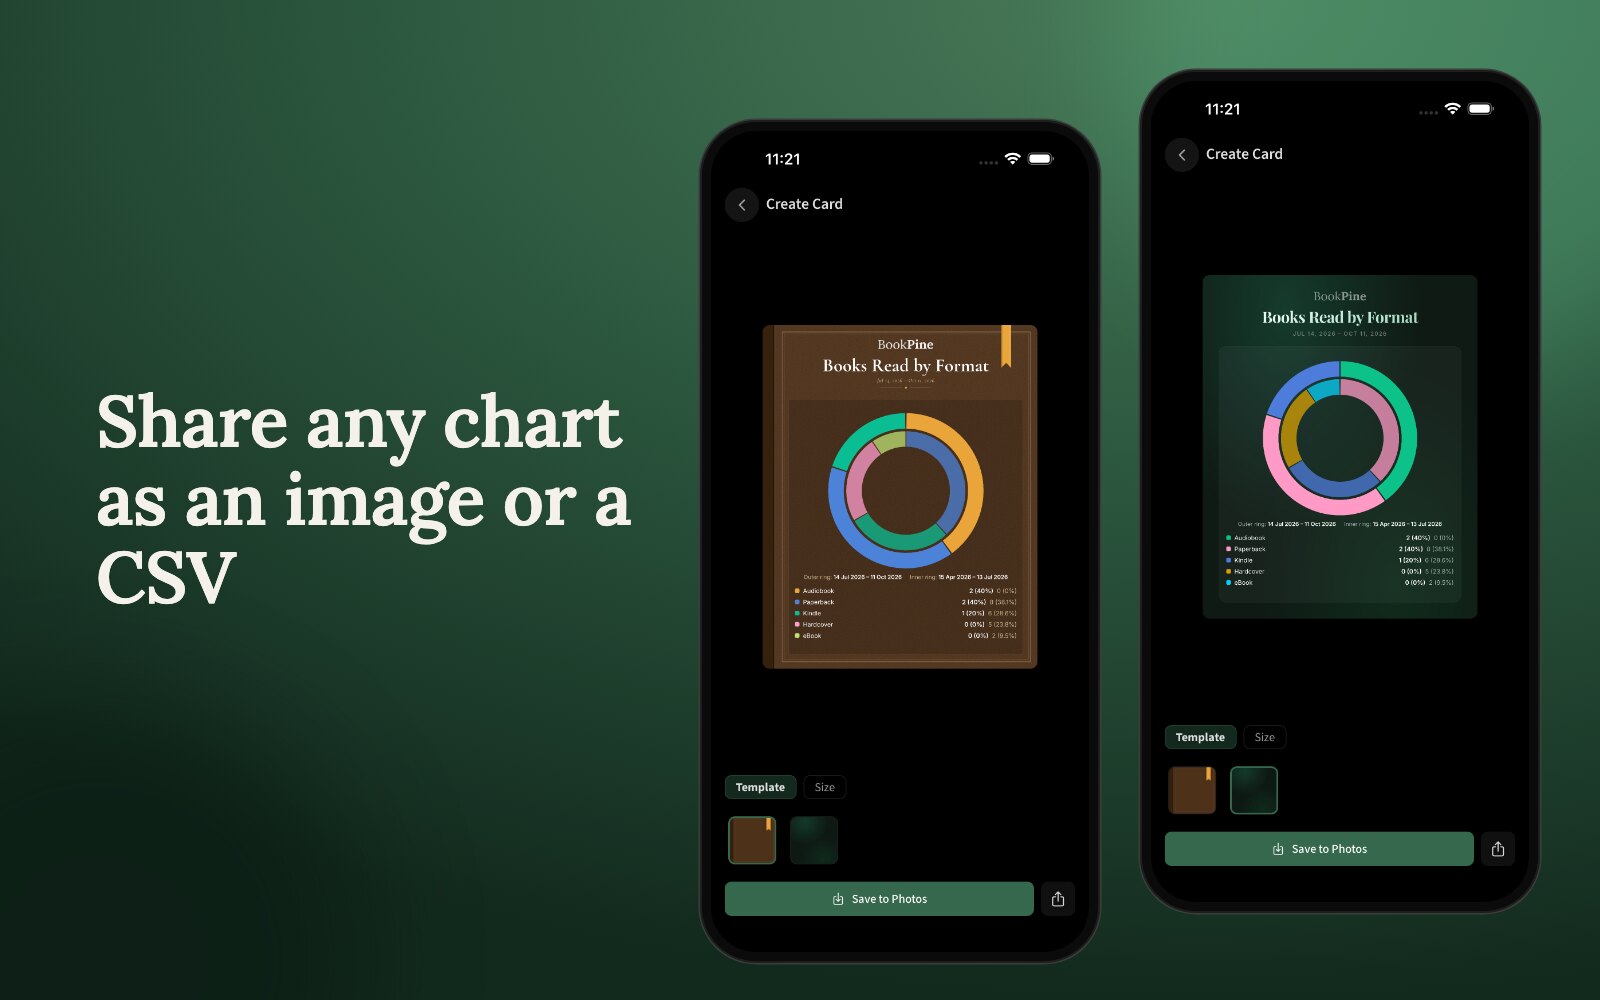
You can take any chart out of BookPine, including the ones in the four reports. Export it as an image to save or share, or grab the CSV if you'd rather poke at the numbers in a spreadsheet.
You can also pin a chart to your home page as a widget, next to your goals and what you're currently reading. And the BookPine app on your phone has the same charts, built from the same reading log.
Half-remembered dates
Plenty of us can't say exactly when we finished a book we read years ago. You can log a read as "May 2019" or just "2019", and the charts count it where it belongs. A May 2019 finish shows up in May and in 2019. A plain 2019 finish shows up in 2019 and all time, and it won't land in January just because it had to go somewhere.
Pages work the same way. If you finished a book without logging sessions, its pages still count in the month or year you finished it. Pace numbers like pages a day only use the sessions you actually logged, since they need real days.
Free and members
Everyone gets the four reports, every chart type, every number, grouping and filter, the templates, and the books behind every value. On a free account you can have one chart of your own, and you can't compare periods or pick your own dates. Members can have as many charts as they like, compare any chart with the previous period or the previous year, and set their own dates.
Everything you've logged so far already counts. Open Library, then Stats, tap New chart and start with something you've wondered about. Do you really read more in winter? Which author do you keep going back to? I'd start there.